Hierarchical cell type annotation
Cytopus now includes a framework for hierarchically annotating single cell data. Thereby single cell annotations data can be fitted into a hierarchical taxonomy. Cytopus finds the most granular cell type labels and fits it into a predefined taxonomy. This facilitates consistent hierarhical annotations by avoiding assigning multiple labels of different branches in a hierarchical cell type taxonomy. It also enables hierarchical queries to subset cell types of interest or assess their marker gene expression. Finally, cells labeled according to a hierarchical taxonomy can be easily be extracted and used to train our hierarchical cell type annotation method Compocyte.
[ ]:
#import packages
import networkx as nx
import cytopus as cp
import scanpy as sc
from matplotlib import rcParams
[ ]:
#load cytopus knowledge base
G = cp.KnowledgeBase()
KnowledgeBase object containing 92 cell types and 201 cellular processes
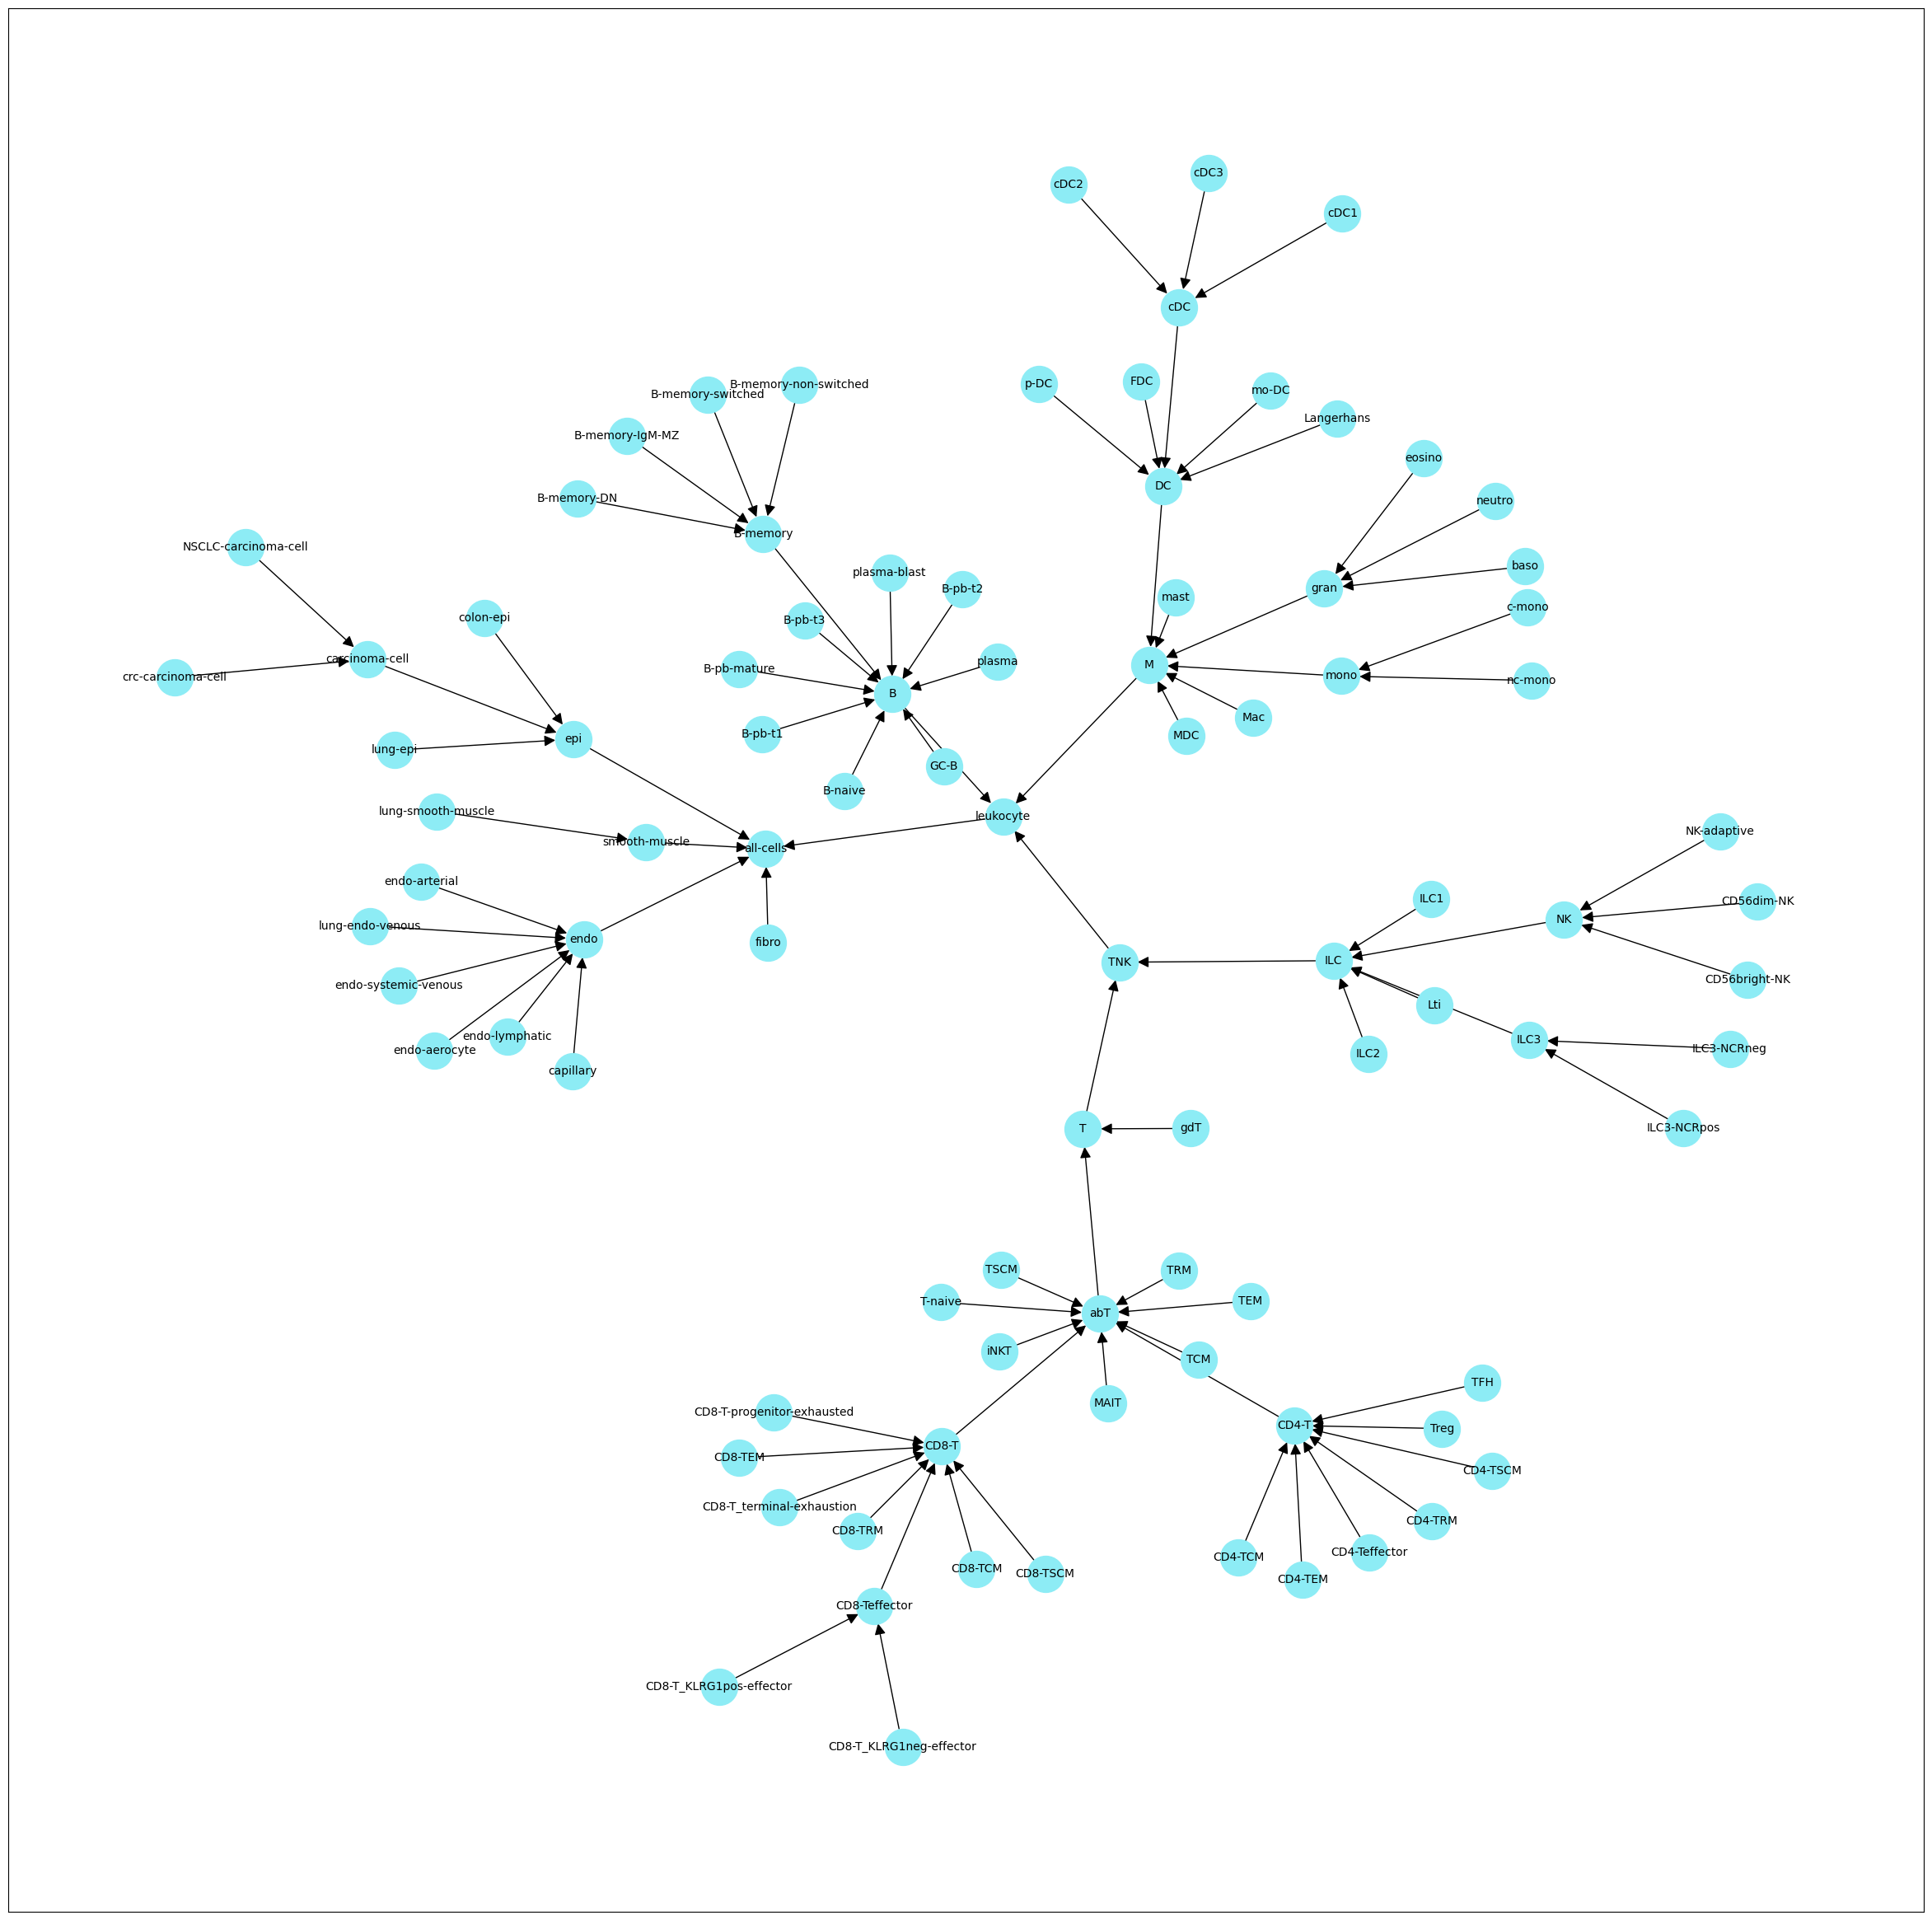
We will now build the hierarchy class which requires a nested dictionary containing the cell type hierarchy of the form
{‘cell_type_a_level_1’:{‘cell_type_b_level_2’:{}, ‘cell_type_c_level_2’:{‘cell_type_d_level_3’:{},’cell_type_e_level_3’:{‘cell_type_f_level_4’:{}}}, ‘cell_type_g_level_2’:{‘cell_type_h_level_3’:{}} }}
[ ]:
#get nested dict of hierarchy in cytopus knowledge base
hierarchy_dict = cp.tl.hierarchy.get_hierarchy_dict(G)
#build hierarchy class
H = cp.tl.hierarchy.Hierarchy(hierarchy_dict)
Hierarchy class containing 92 cell types:['B', 'B-memory', 'B-memory-DN', 'B-memory-IgM-MZ', 'B-memory-non-switched', 'B-memory-switched', 'B-naive', 'B-pb-mature', 'B-pb-t1', 'B-pb-t2', 'B-pb-t3', 'CD4-T', 'CD4-TCM', 'CD4-TEM', 'CD4-TRM', 'CD4-TSCM', 'CD4-Teffector', 'CD56bright-NK', 'CD56dim-NK', 'CD8-T', 'CD8-T-progenitor-exhausted', 'CD8-TCM', 'CD8-TEM', 'CD8-TRM', 'CD8-TSCM', 'CD8-T_KLRG1neg-effector', 'CD8-T_KLRG1pos-effector', 'CD8-T_terminal-exhaustion', 'CD8-Teffector', 'DC', 'FDC', 'GC-B', 'ILC', 'ILC1', 'ILC2', 'ILC3', 'ILC3-NCRneg', 'ILC3-NCRpos', 'Langerhans', 'Lti', 'M', 'MAIT', 'MDC', 'Mac', 'NK', 'NK-adaptive', 'NSCLC-carcinoma-cell', 'T', 'T-naive', 'TCM', 'TEM', 'TFH', 'TNK', 'TRM', 'TSCM', 'Treg', 'abT', 'all-cells', 'baso', 'c-mono', 'cDC', 'cDC1', 'cDC2', 'cDC3', 'capillary', 'carcinoma-cell', 'colon-epi', 'crc-carcinoma-cell', 'endo', 'endo-aerocyte', 'endo-arterial', 'endo-lymphatic', 'endo-systemic-venous', 'eosino', 'epi', 'fibro', 'gdT', 'gran', 'iNKT', 'leukocyte', 'lung-endo-venous', 'lung-epi', 'lung-smooth-muscle', 'mast', 'mo-DC', 'mono', 'nc-mono', 'neutro', 'p-DC', 'plasma', 'plasma-blast', 'smooth-muscle']
[ ]:
#inspect cell type hierarchy
H.plot_celltypes(figsize=[30,30])
load example data
[ ]:
#paths
import importlib.resources as pkg_resources
import cytopus.data
with pkg_resources.path(cytopus.data, 'adata_spectra.h5ad') as file_path:
    adata = sc.read_h5ad(file_path)
/tmp/ipykernel_11221/3241767917.py:4: DeprecationWarning: path is deprecated. Use files() instead. Refer to https://importlib-resources.readthedocs.io/en/latest/using.html#migrating-from-legacy for migration advice.
  with pkg_resources.path(cytopus.data, 'adata_spectra.h5ad') as file_path:
[ ]:
#annotations are stored here
adata.obs[['annotation_level_1', 'annotation_level_2', 'annotation_level_3']]
| annotation_level_1 | annotation_level_2 | annotation_level_3 | |
|---|---|---|---|
| 0 | B | B | B-naive |
| 1 | TNK | CD8-T | CD8-T |
| 2 | TNK | CD8-T | CD8-T |
| 3 | M | M | MDC |
| 4 | TNK | CD4-T | Treg |
| ... | ... | ... | ... |
| 9995 | B | B | B-memory |
| 9996 | TNK | CD8-T | CD8-T |
| 9997 | B | B | B-naive |
| 9998 | M | M | MDC |
| 9999 | TNK | CD4-T | CD4-T |
10000 rows × 3 columns
[ ]:
#add cells to annotation object
H.add_cells(adata, obs_columns=['annotation_level_1', 'annotation_level_2', 'annotation_level_3'])
[ ]:
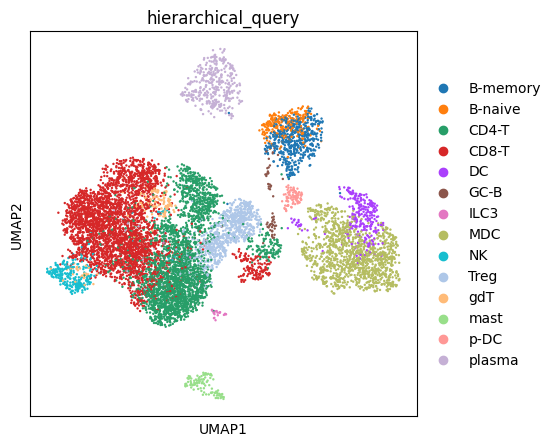
#starting on top of the hierarchy we can find the most granular cell type label for each cell
H.query_ancestors(query_node='leukocyte', adata=adata, obs_key='hierarchical_query')
[ ]:
#the output will be added to a dictionary
H.annotations.keys()
dict_keys(['cDC1', 'TRM', 'nc-mono', 'CD8-T', 'Mac', 'eosino', 'cDC', 'NK', 'MAIT', 'CD4-TRM', 'DC', 'B-naive', 'ILC2', 'abT', 'neutro', 'CD8-T_KLRG1neg-effector', 'CD8-TRM', 'NK-adaptive', 'B', 'gran', 'CD8-T_KLRG1pos-effector', 'B-memory-non-switched', 'FDC', 'GC-B', 'c-mono', 'TCM', 'TFH', 'B-pb-t2', 'B-memory-IgM-MZ', 'CD4-TCM', 'CD4-TEM', 'CD4-T', 'B-memory', 'CD56bright-NK', 'ILC', 'plasma-blast', 'B-memory-switched', 'cDC3', 'iNKT', 'Treg', 'CD8-T_terminal-exhaustion', 'T-naive', 'CD8-Teffector', 'ILC1', 'TEM', 'cDC2', 'CD4-Teffector', 'TNK', 'leukocyte', 'baso', 'mo-DC', 'plasma', 'ILC3', 'mono', 'B-pb-mature', 'B-memory-DN', 'M', 'T', 'CD8-TSCM', 'p-DC', 'CD56dim-NK', 'B-pb-t3', 'CD4-TSCM', 'ILC3-NCRpos', 'CD8-T-progenitor-exhausted', 'mast', 'Langerhans', 'MDC', 'gdT', 'B-pb-t1', 'TSCM', 'CD8-TCM', 'CD8-TEM', 'Lti', 'ILC3-NCRneg'])
[ ]:
#and to the adata
adata.obs['hierarchical_query'].head()
0    B-naive
1      CD8-T
2      CD8-T
3        MDC
4       Treg
Name: hierarchical_query, dtype: object
[ ]:
FIGSIZE = (5, 5)
rcParams["figure.figsize"] = FIGSIZE
sc.pl.umap(adata,color='hierarchical_query')
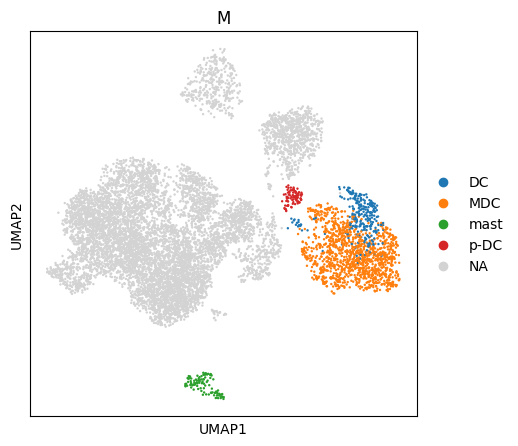
You can also use this information to subset your data using the hierarchy. E.g. we can retrieve all myeloid cell ‘M’ with all their subsets.
[ ]:
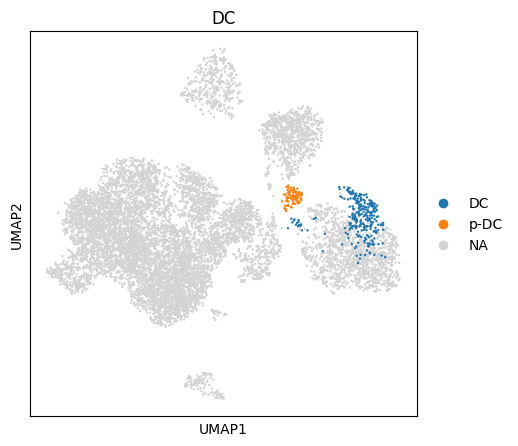
#starting on top of the hierarchy we can find the most granular cell type label for each cell
H.query_ancestors(query_node='M', adata=adata, obs_key='M')
H.query_ancestors(query_node='DC', adata=adata, obs_key='DC')
[ ]:
sc.pl.umap(adata,color='M')
sc.pl.umap(adata,color='DC')
[ ]:
#subset your adata
adata_myeloid = adata[~adata.obs['M'].isna()]
adata_myeloid
View of AnnData object with n_obs × n_vars = 1673 × 6397
    obs: 'cell_type_annotations', 'annotation_level_3', 'annotation_level_2', 'annotation_level_1', 'hierarchical_query', 'mono', 'M', 'DC'
    var: 'n_cells_by_counts', 'highly_variable', 'spectra_vocab'
    uns: 'DC_colors', 'M_colors', 'SPECTRA_L', 'SPECTRA_factors', 'SPECTRA_markers', 'annotation_SPADE_1_colors', 'cell_type_annotations_colors', 'diffmap_evals', 'draw_graph', 'hierarchical_query_colors', 'hvg', 'neighbors', 'pca'
    obsm: 'SPECTRA_cell_scores', 'X_diffmap', 'X_draw_graph_fa', 'X_pca', 'X_tsne', 'X_umap'
    varm: 'PCs'
    obsp: 'connectivities', 'distances'